Mapping California's Politically Vulnerable Communities
Archived PRoject
In 2015, the Center for Inclusive Democracy (CID), formerly the California Civic Engagement Project when housed at UC Davis, presented an innovative visualization of political participation in California’s communities. Using geographic information system (GIS) technology, CID created a publicly available interactive web platform that maps the relationship between low voter turnout and the economic, educational and health challenges faced by communities in our state.
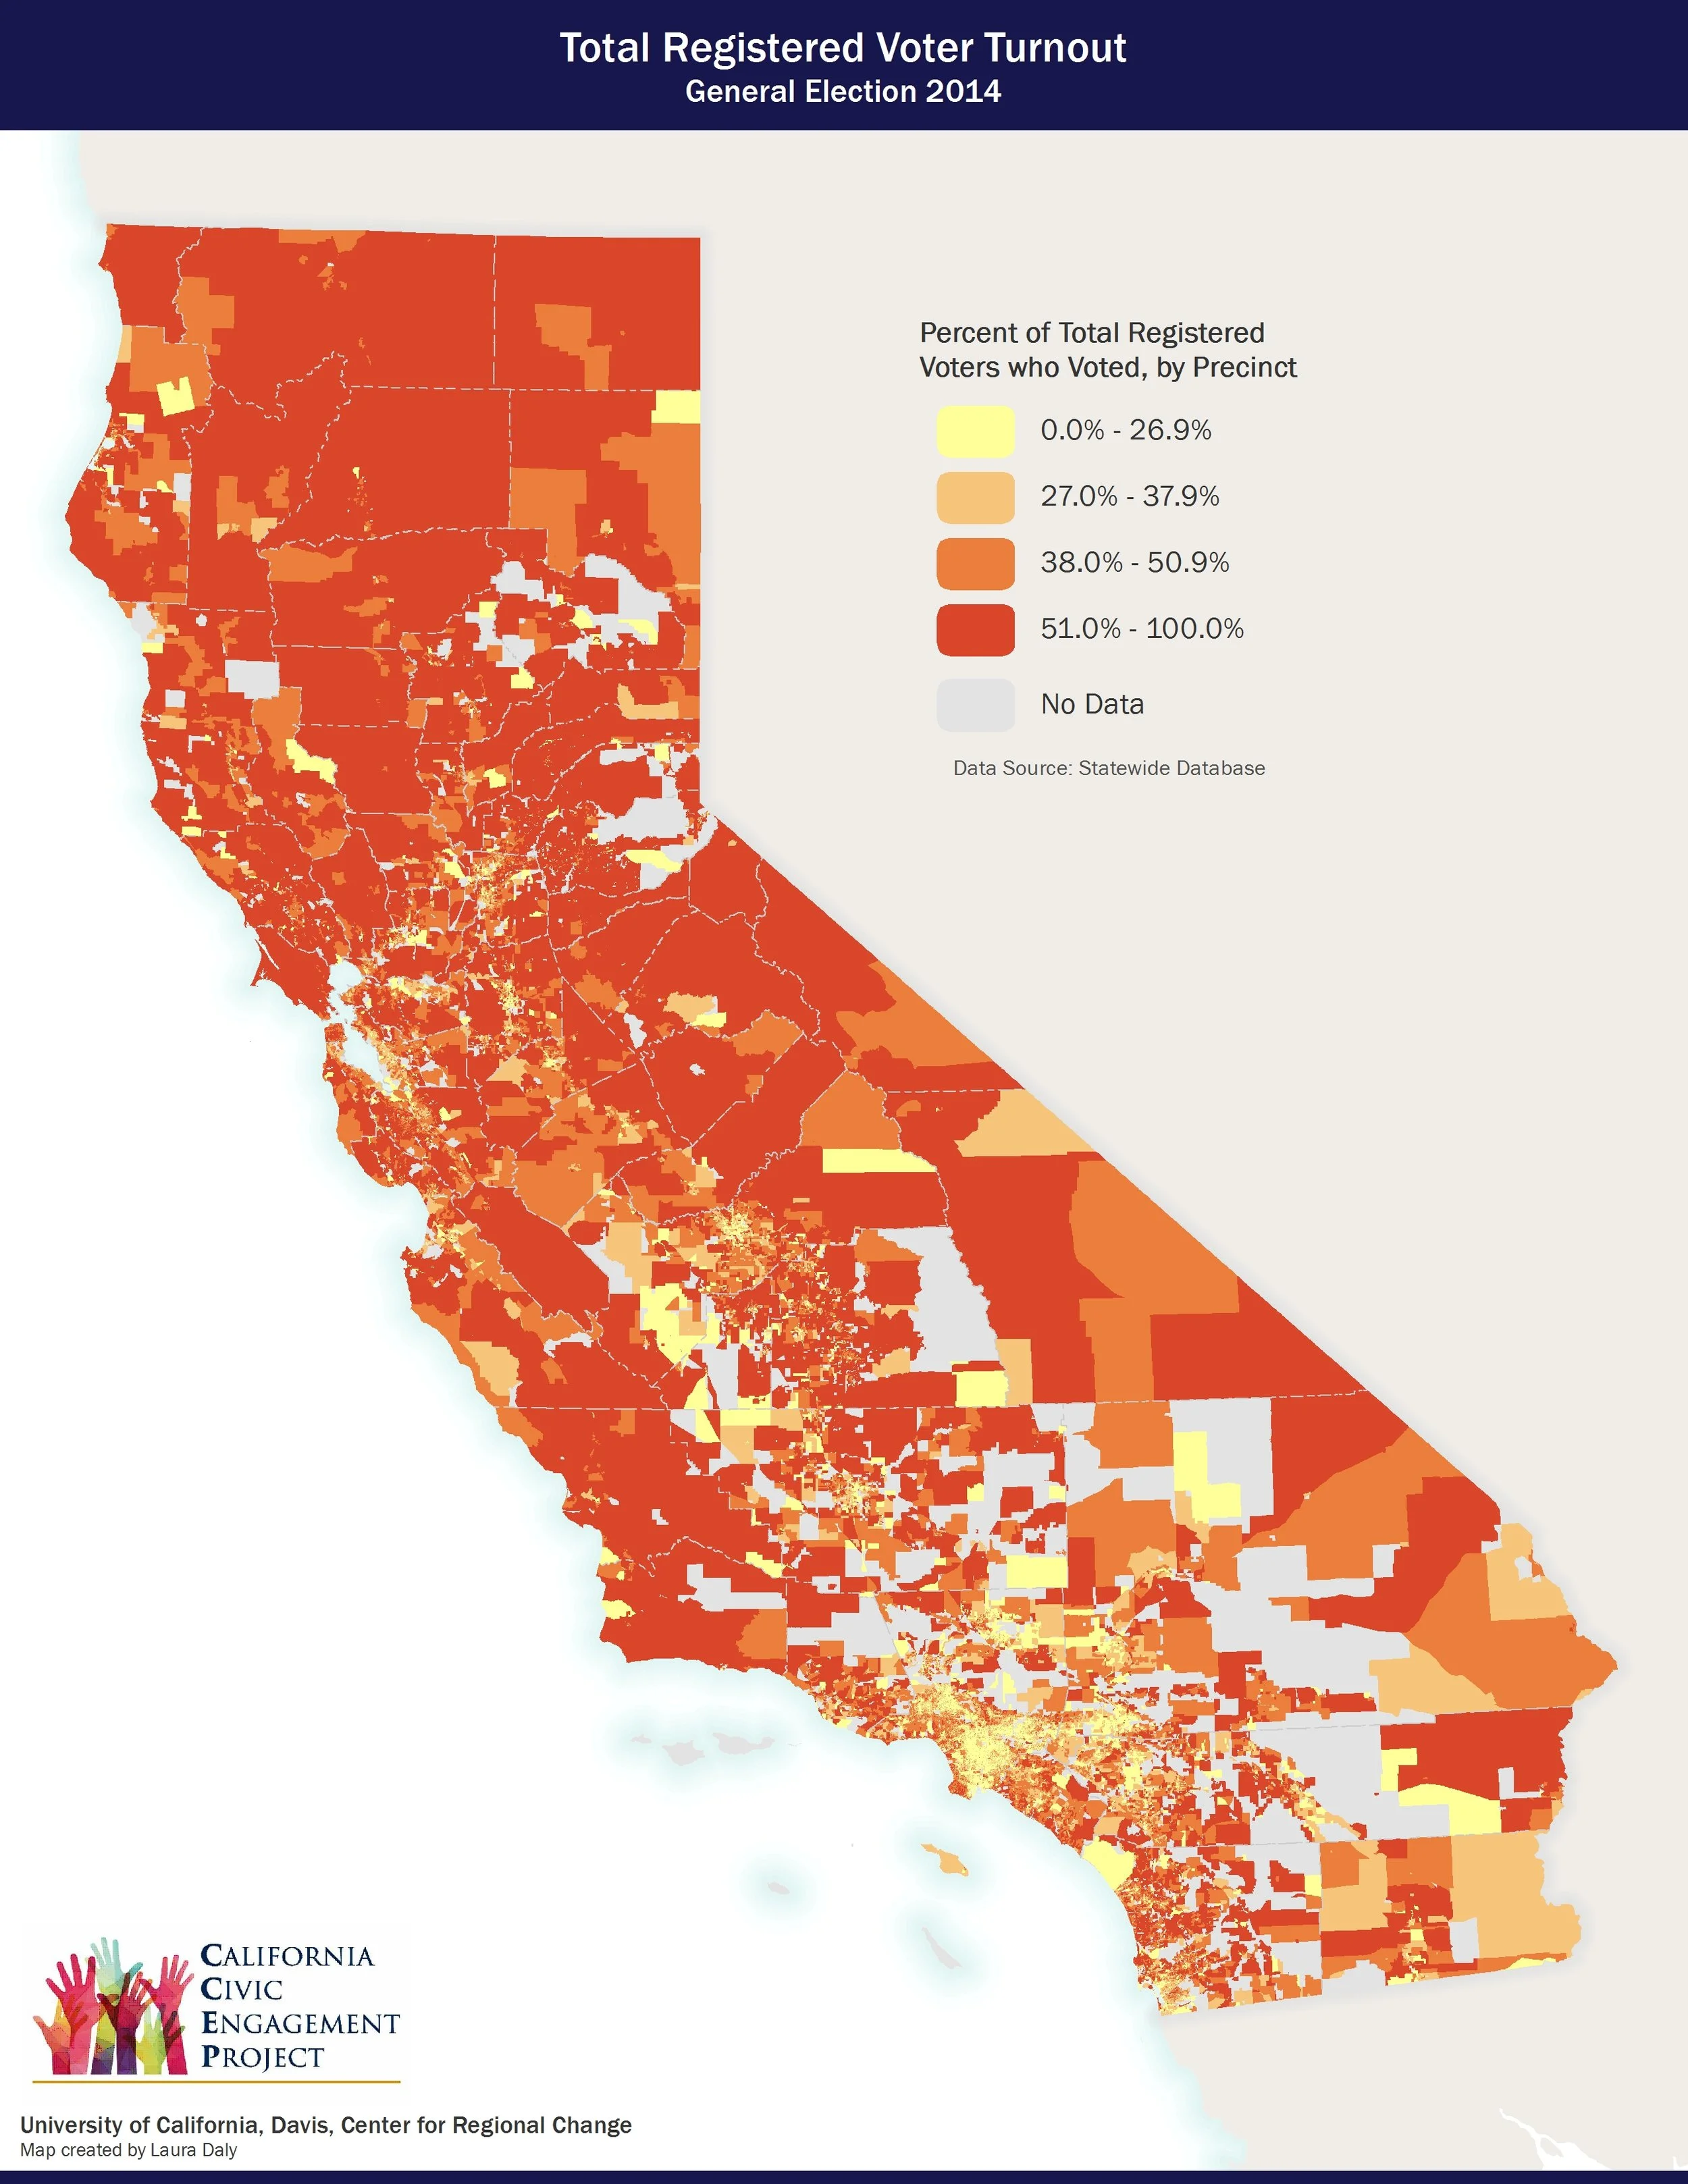
This interactive mapping tool allows users to identify areas of high and low voter turnout in the 2012 and 2014 general elections, down to the neighborhood precinct level. These interactive maps also allow users to investigate the interplay between electoral participation and economic, educational and health outcomes. Please see our Interactive 2014 General Election Maps. Click here for our Interactive 2012 General Election Maps.
Also available from CID are a series of Static GIS Maps visualizing the relationship between low voter turnout (including maps of total, Latino, Asian-American and youth turnout) in California communities and economic, educational and health challenges. Click here for detailed project methodology.
For examples of ways the mapping tool and static maps could be used by community leaders, advocates, media, public officials, and others, click here. This project is funded in part by a grant from The James Irvine Foundation.